
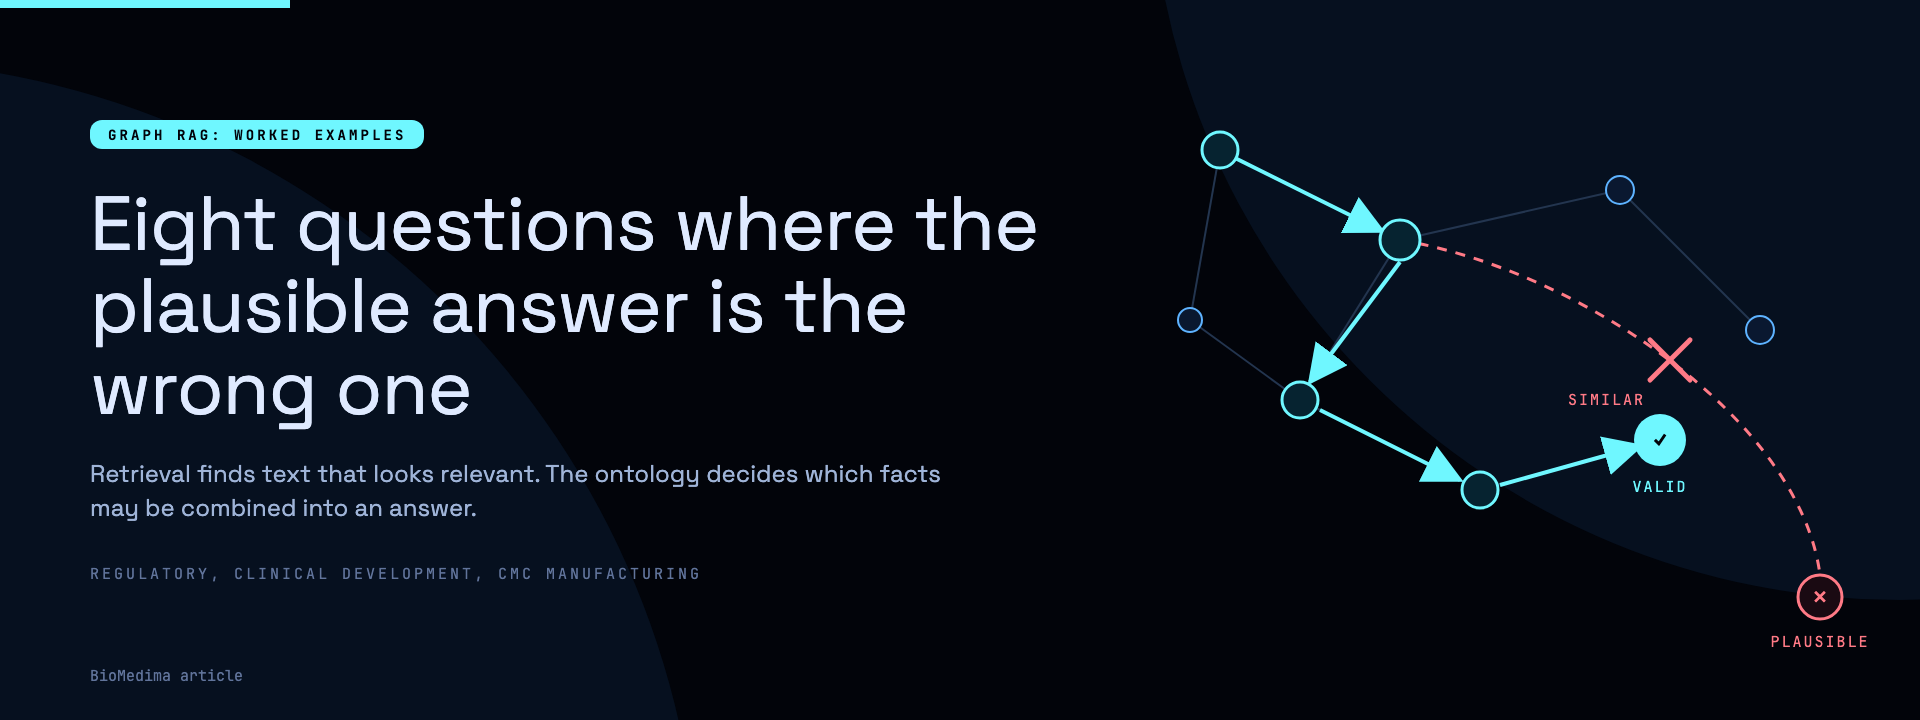
Retrieval finds text that looks relevant. A graph decides which facts are allowed to go together.
Ask a document-based AI assistant which site releases a batch, or whether a lot can ship to Japan next month. It will answer fluently and cite its sources. In the eight cases below every cited passage is true, and every answer is still wrong.
Nothing was invented. The assistant combined true facts that should never have been combined.
I collected these eight questions while preparing a deck on where retrieval-augmented generation (RAG) breaks in pharma, and what Graph RAG, a knowledge graph built on an ontology, does differently. They come from regulatory, clinical development and CMC manufacturing. Some are easy to spot once you see them; others took me a while. The products, batches and sites are synthetic, and the value figures are illustrative.
Why RAG goes wrong, in plain terms
Think of RAG as a diligent intern with a search engine. It cuts your documents into paragraphs, finds the ones that sound most like your question, and hands them to a language model to write an answer.
Four things go wrong with that, and each has a technical cause.
- Things that sound alike get treated as the same. RAG ranks paragraphs by how close their embeddings are (cosine similarity). In that space manufactured dose form and administrable dose form sit almost on top of each other. A vector has no slot for “these are two different relationships”.
- Facts lose their links. The answer often needs one fact from the protocol, one from the lab manual and one from a registration. Retrieval returns the top few chunks independently, with no key to join them on, so a missing piece goes unnoticed.
- Whatever is said most gets found first. Ranking rewards repetition and prominence. The site named fourteen times wins, and so does the supplier change everybody wrote about, whether or not either is the answer.
- Text doesn’t know when, for whom, or what is missing. A paragraph carries no market and no validity date. And when nothing turns up, the model reads silence as “no” when the honest answer is “we don’t know”.
Why Graph RAG gets it right, in plain terms
A knowledge graph is closer to a road map. Products, sites, batches and lots are places. Relationships are roads, each with a sign on it: is released at, was consumed by, is valid until. The ontology is the highway code that says which roads exist and where they may lead. A question becomes a route, and an answer only counts if the route is legal.
Five technical features do the work behind that picture:
- Typed relationships. Each relationship has its own identifier, so has manufactured dose form can never stand in for has administrable dose form.
- Events are things. Reconstitution, consumption and sample collection are nodes with their own dates, inputs and outputs, so “before” and “after” can be asked about separately.
- Rules you can check. SHACL shapes and query filters hold the hard constraints (same product, same market, valid on this date). A combination that breaks one gets rejected outright instead of ranked a bit lower.
- Counting and tracing by structure. SPARQL counts distinct entities with
COUNT DISTINCTand follows chains of any length with property paths. Nobody asks a language model to count rows of text. - Unknown is an answer. “Not impacted” and “no record” are stored as results, each with its source and version.
In Graph RAG the graph settles what is true, and the language model explains it. The model writes the prose. It doesn’t get to choose the facts.
Eight examples
Each figure reads left to right: what retrieval answers and why it fails, the route through the graph, then the graph’s answer.
01. The dose form the patient actually receives
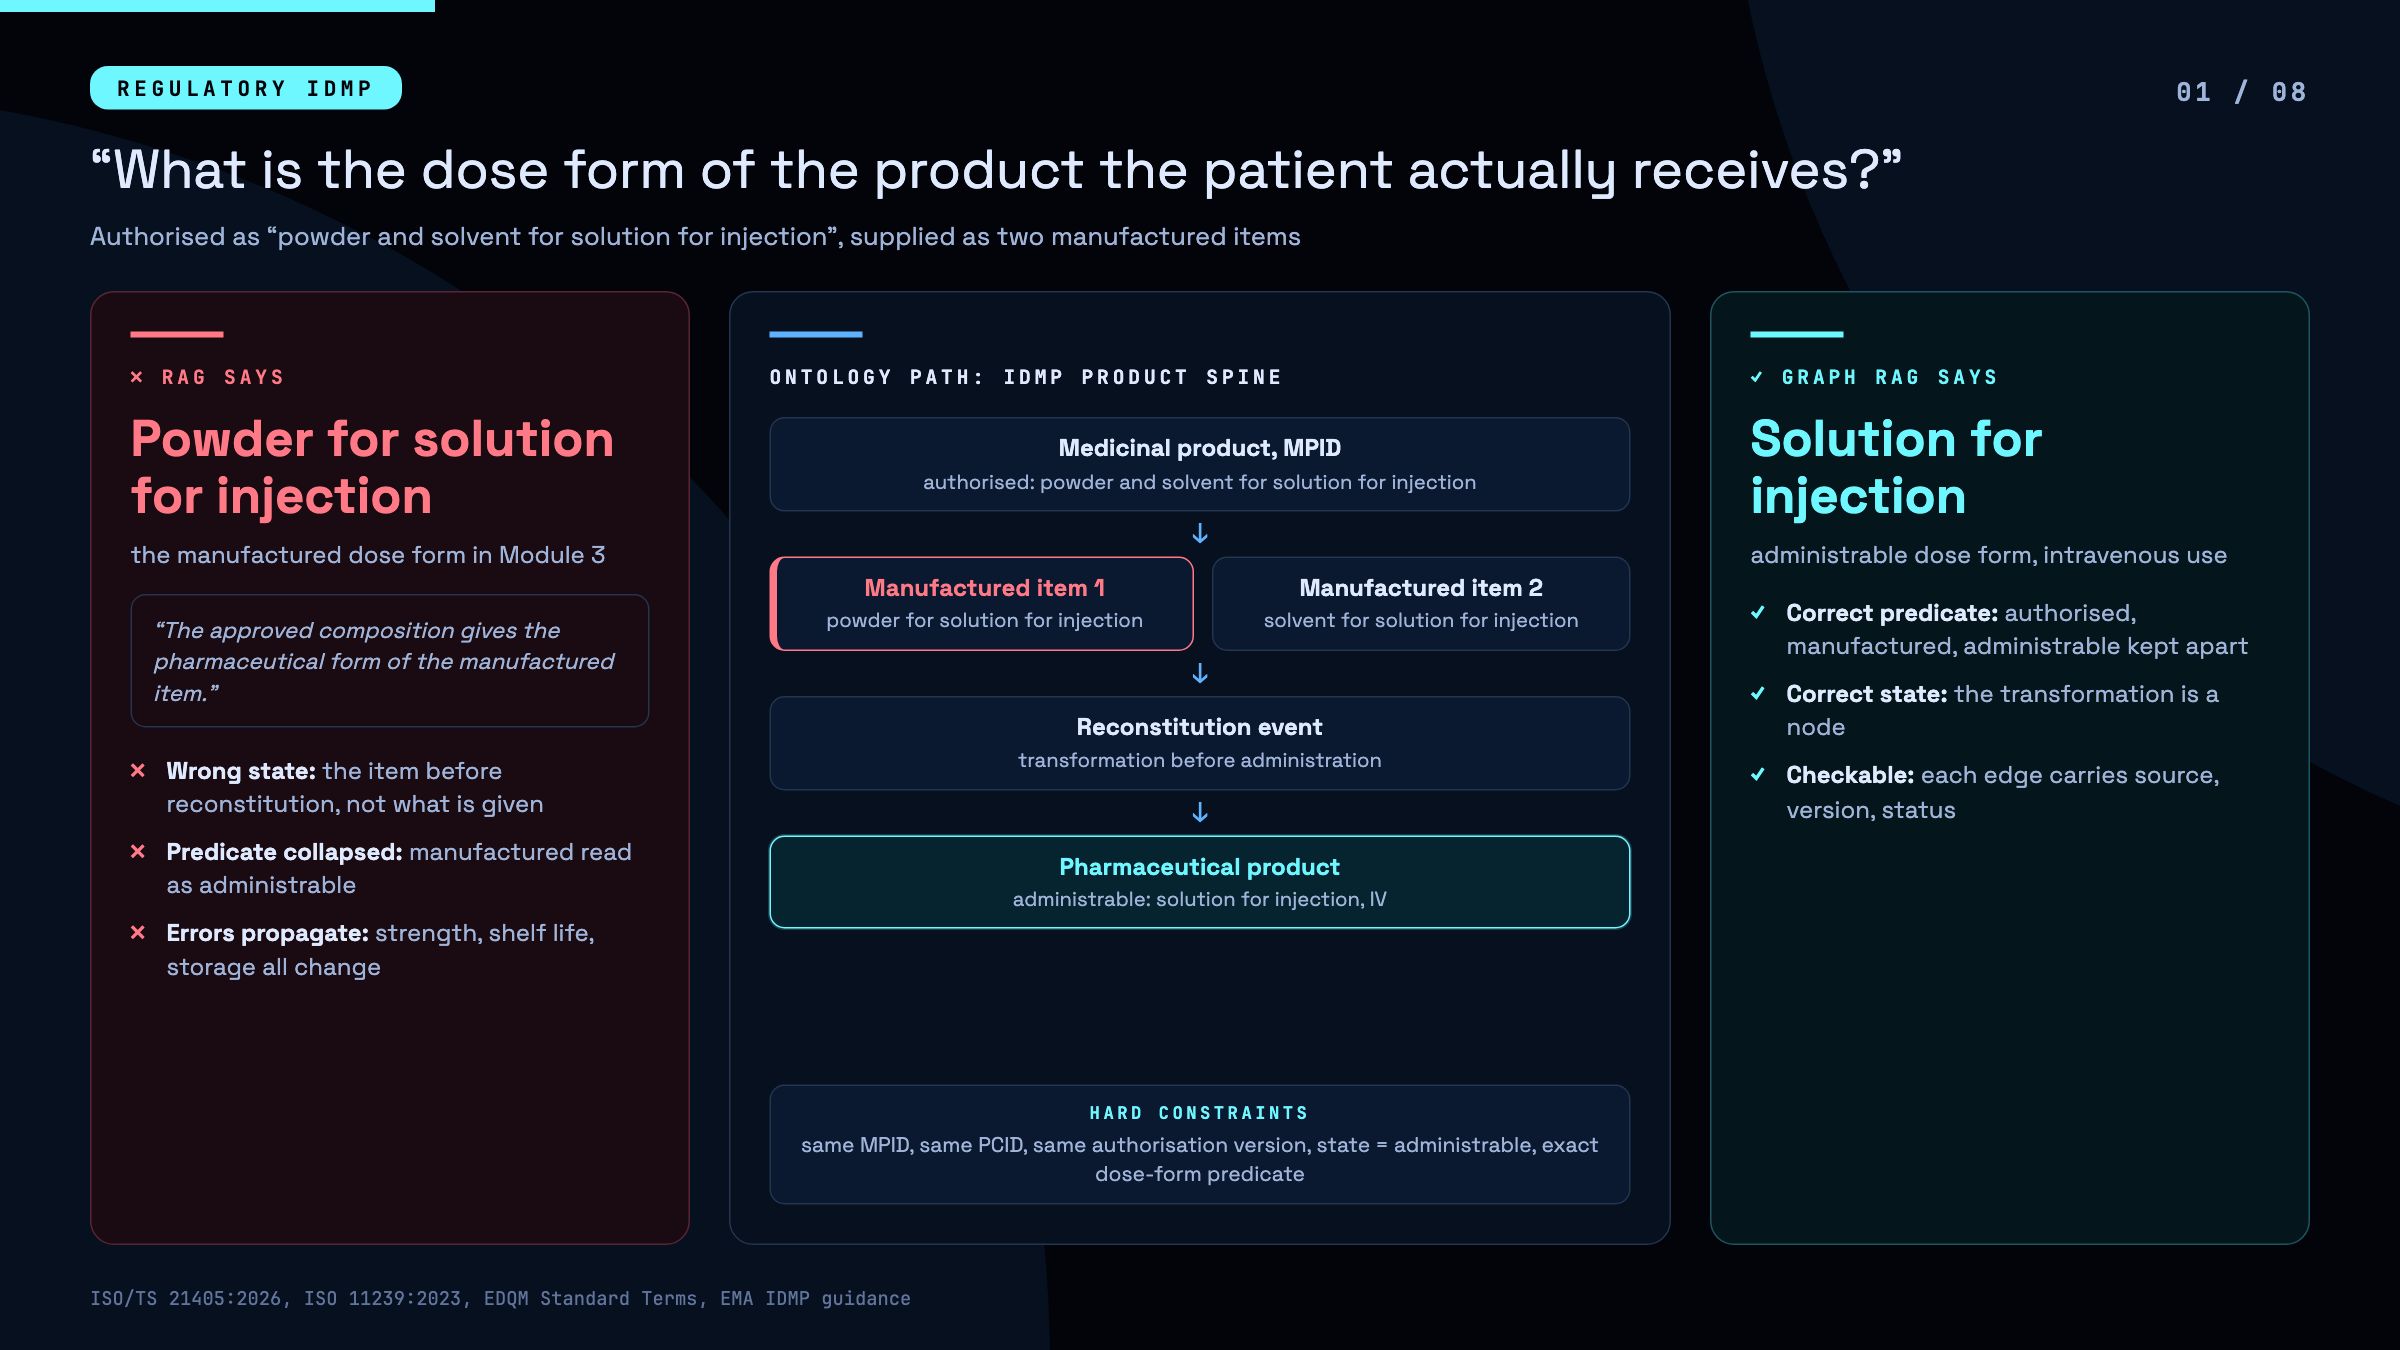
Why RAG fails: the vial holds a powder, and the documents describe that powder in loving detail, so RAG answers about the vial instead of the syringe (reasons 1 and 4).
Why Graph RAG succeeds: reconstitution is a node. The form that exists after it has its own relationship, which is how the ISO IDMP dose-form standards intend it.
02. The site that releases batches for the EU
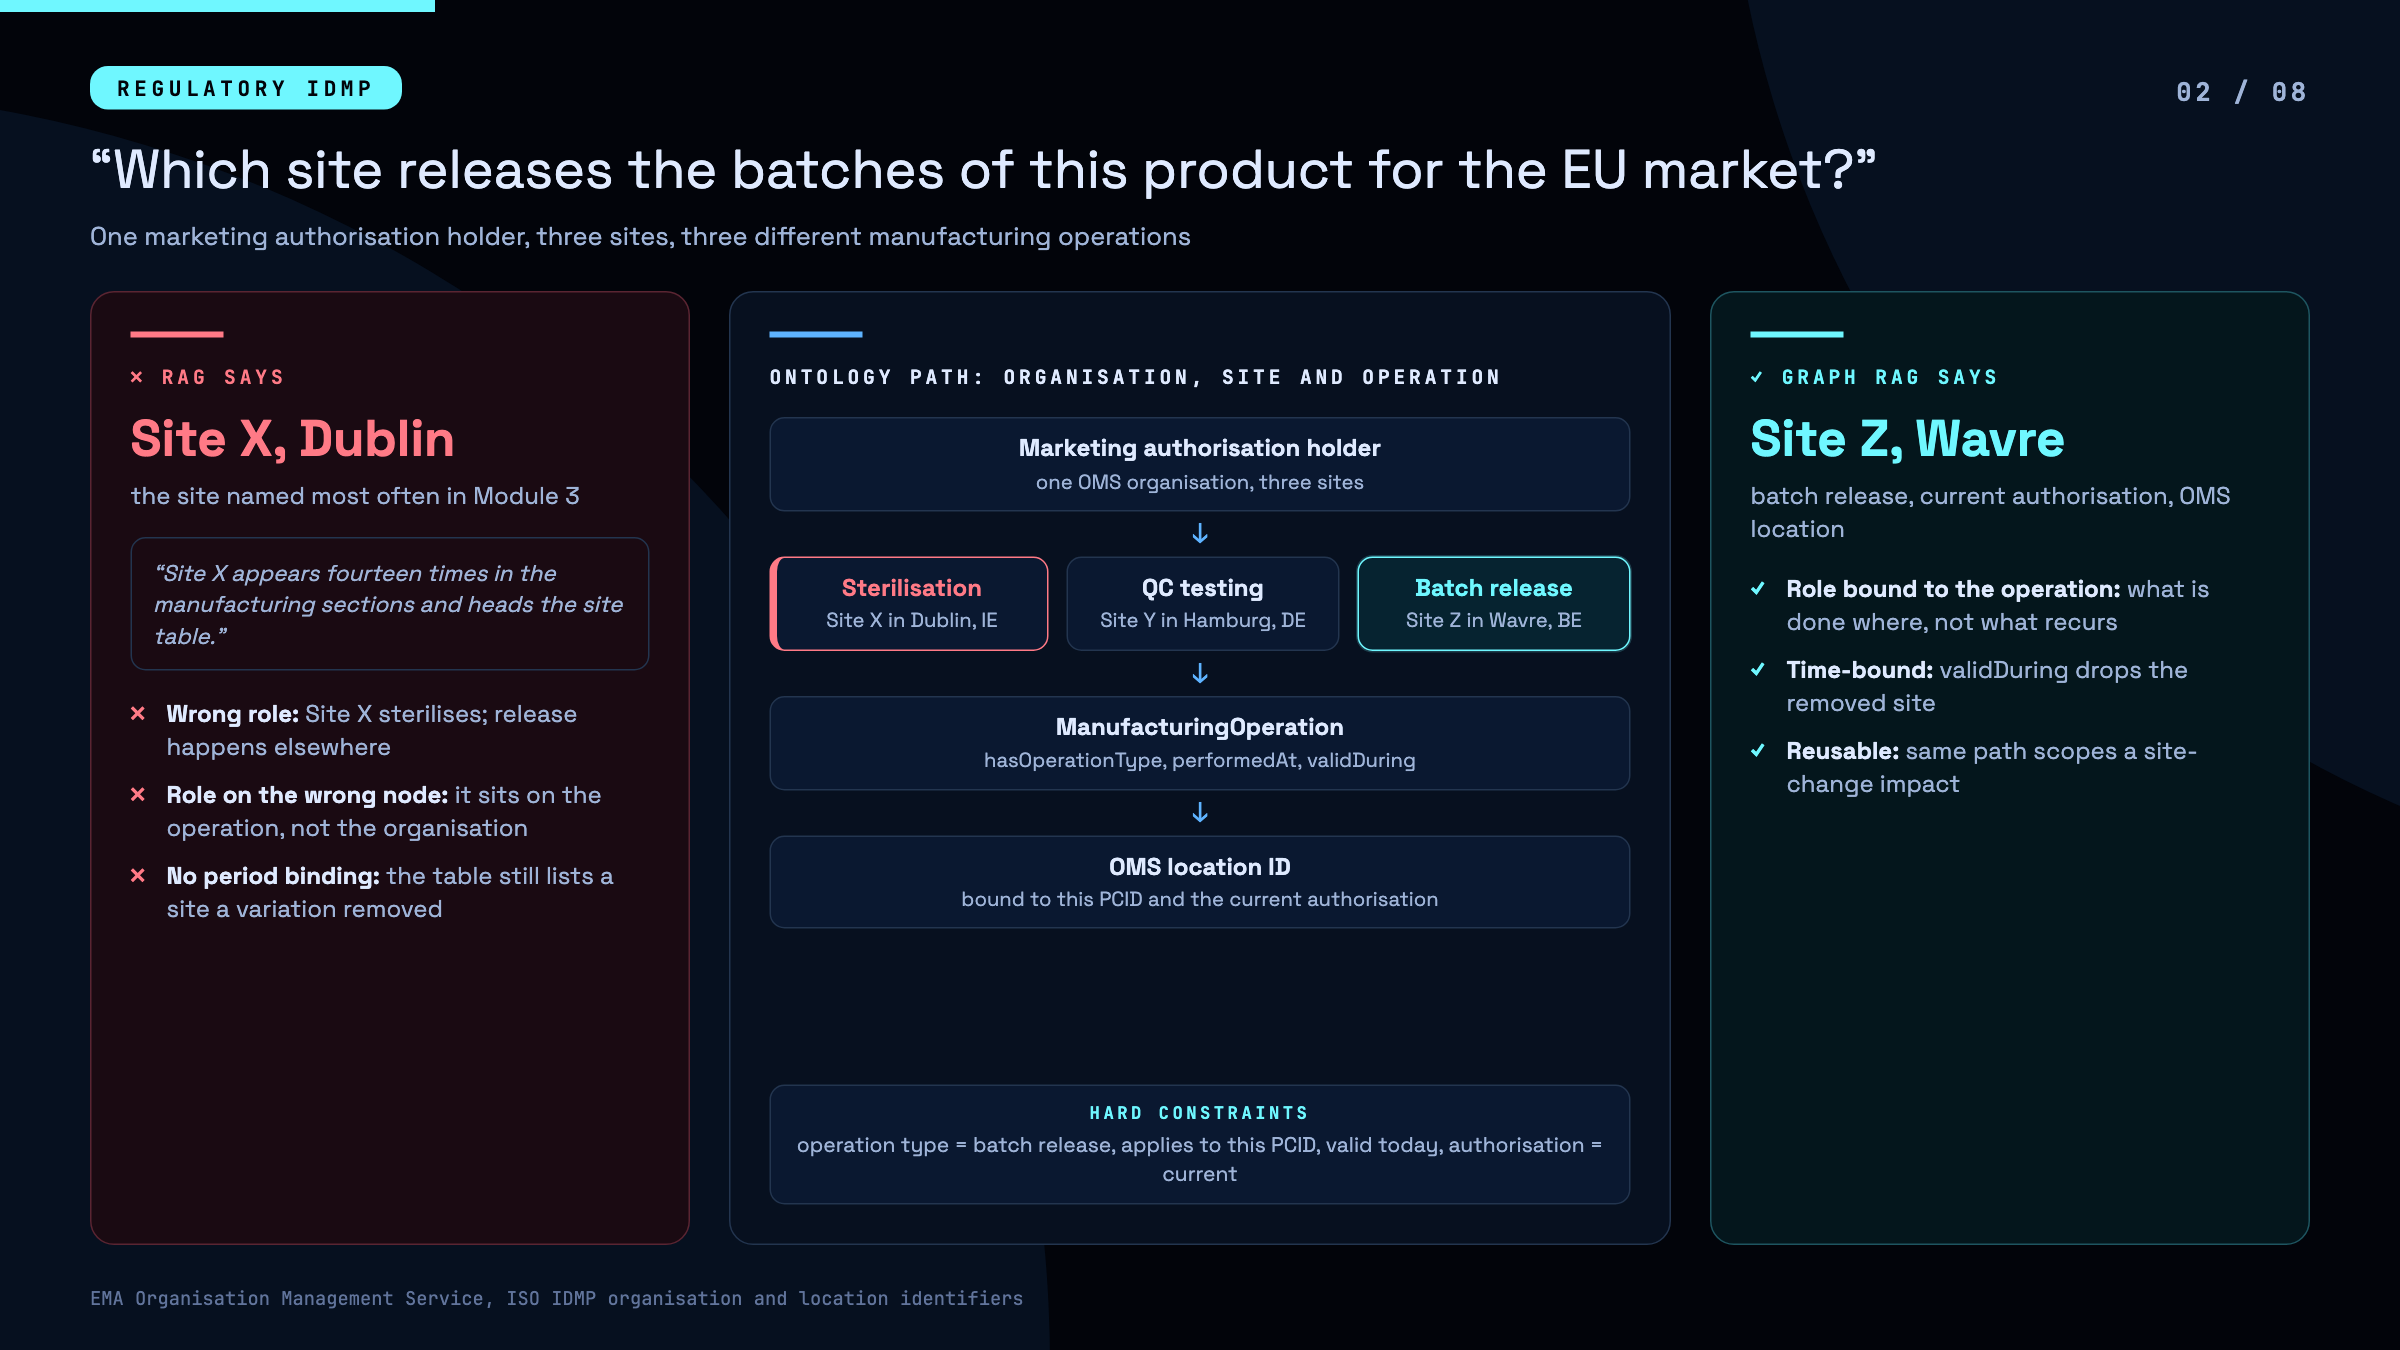
Why RAG fails: the most-mentioned site wins. The site table also still lists a site that a variation removed (reasons 3 and 4).
Why Graph RAG succeeds: the release role sits on the operation, not on the company. Each operation points to an EMA OMS location and carries a validity period, so the query simply asks for “batch release, valid today”.
03. Blood draws on Cycle 1 Day 1
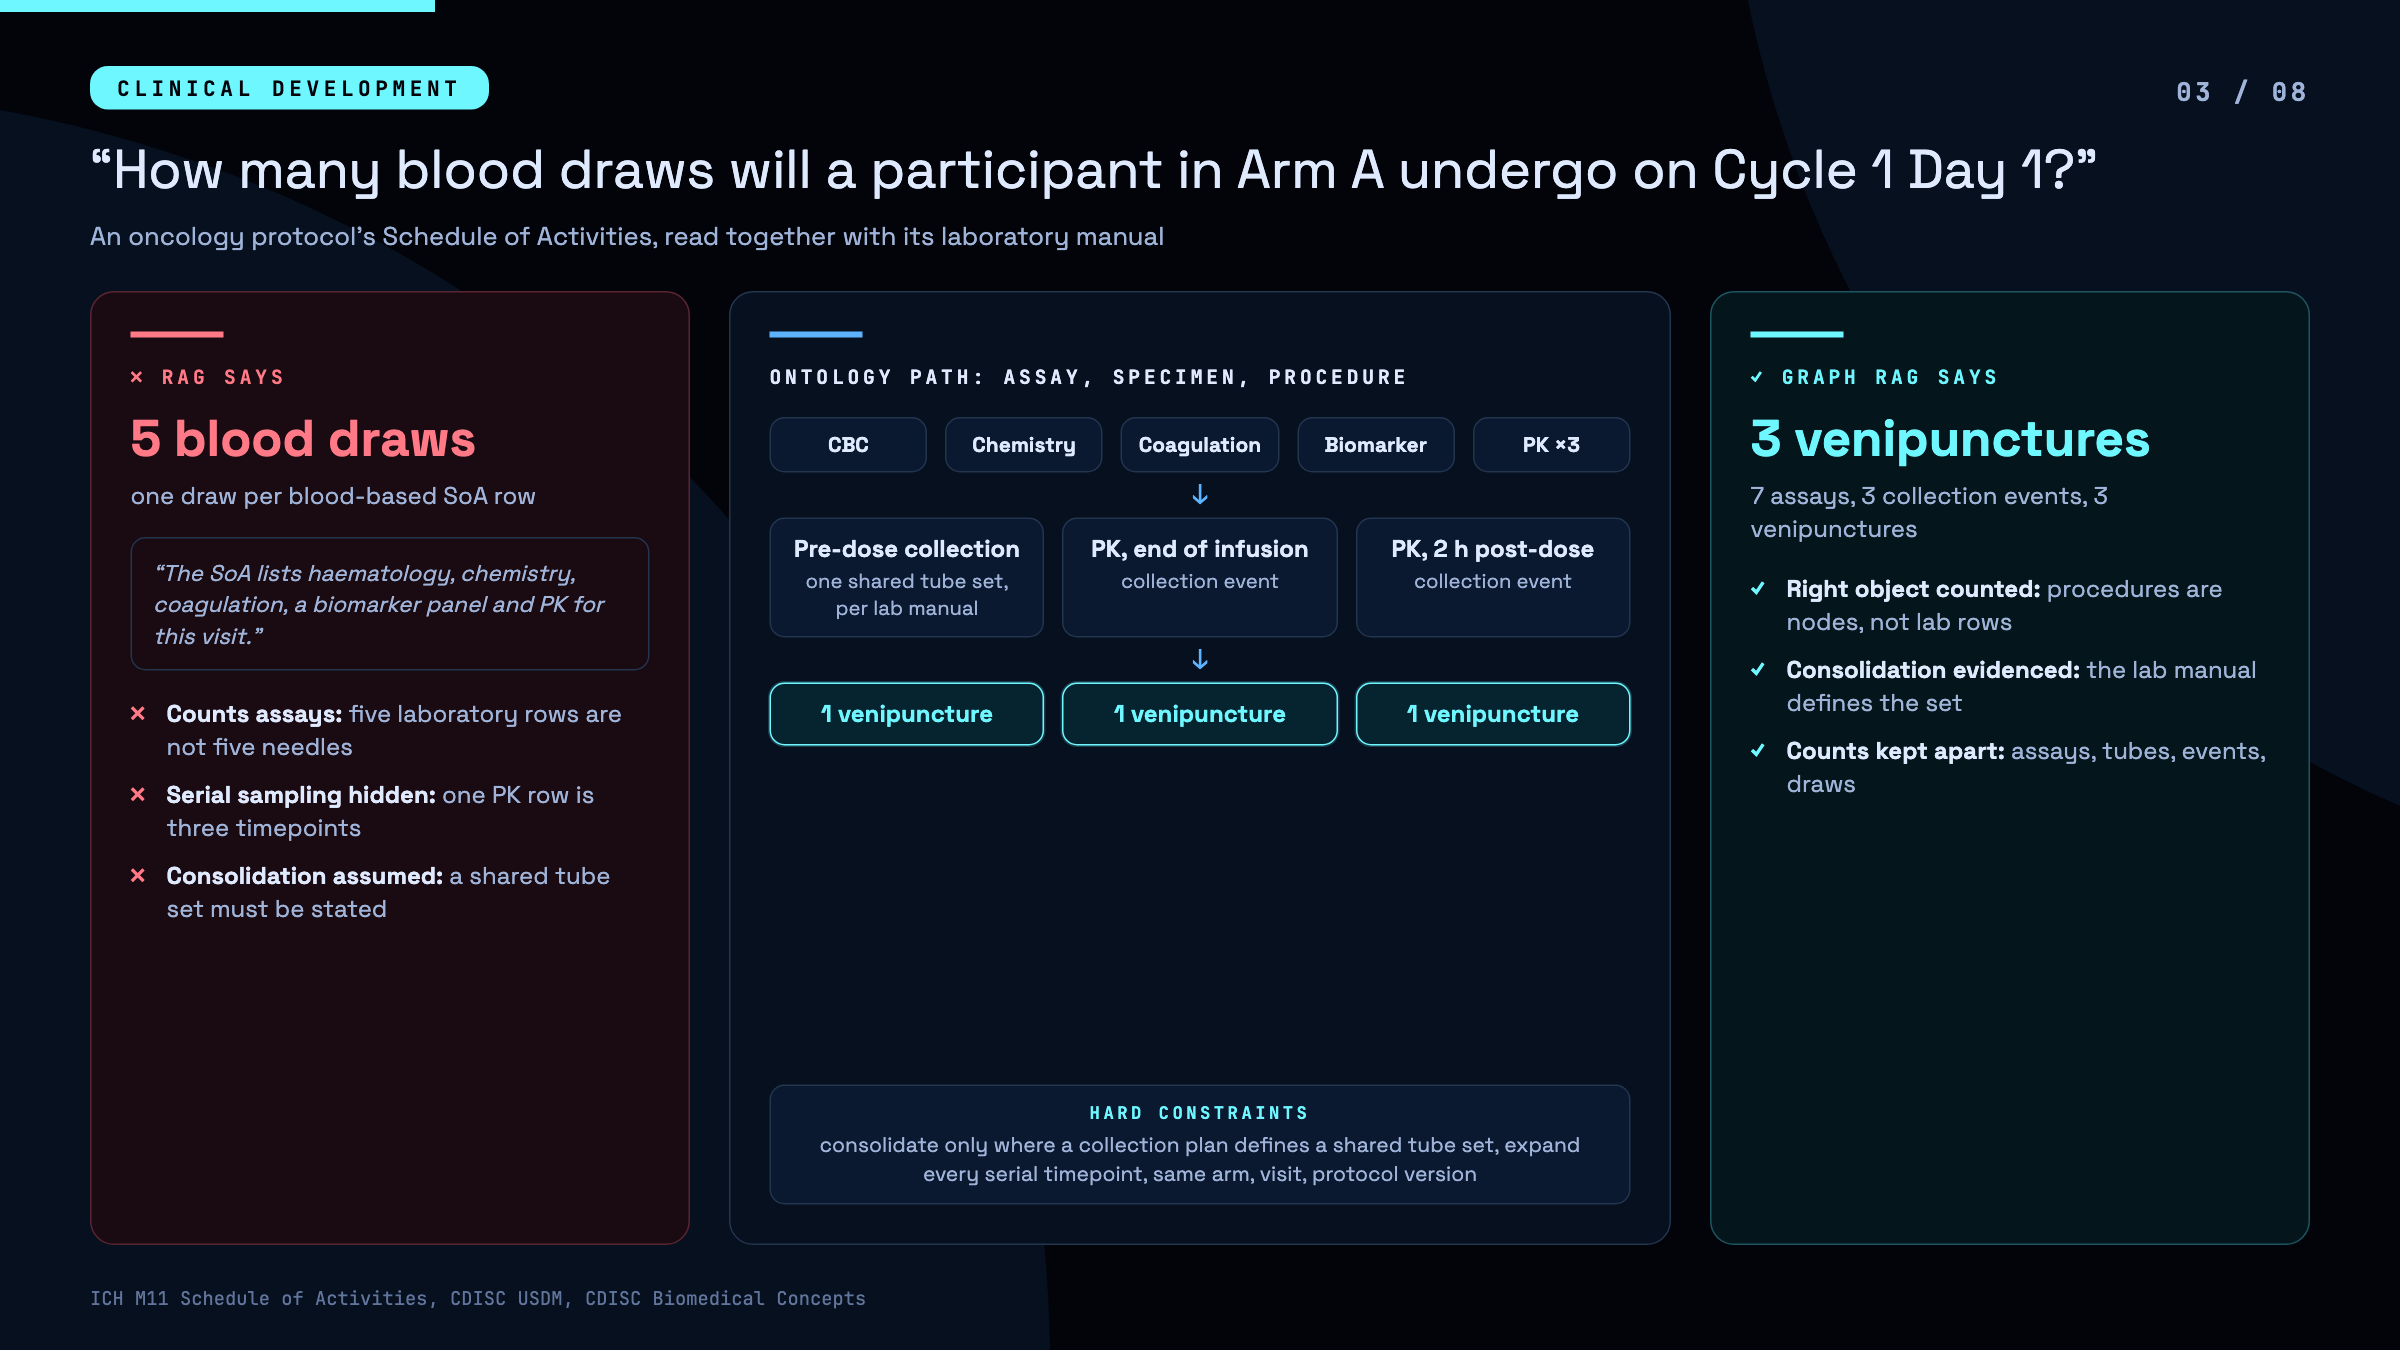
Why RAG fails: it counts lab rows as needles. The single PK row hides three timepoints that are written down in another document (reasons 2 and 4).
Why Graph RAG succeeds: assays, specimens, collection events and venipunctures are different kinds of thing, and the query counts venipunctures. Tests share a tube set only where the lab manual says they do.
04. What Cycle 1 Day 1 should cost a site
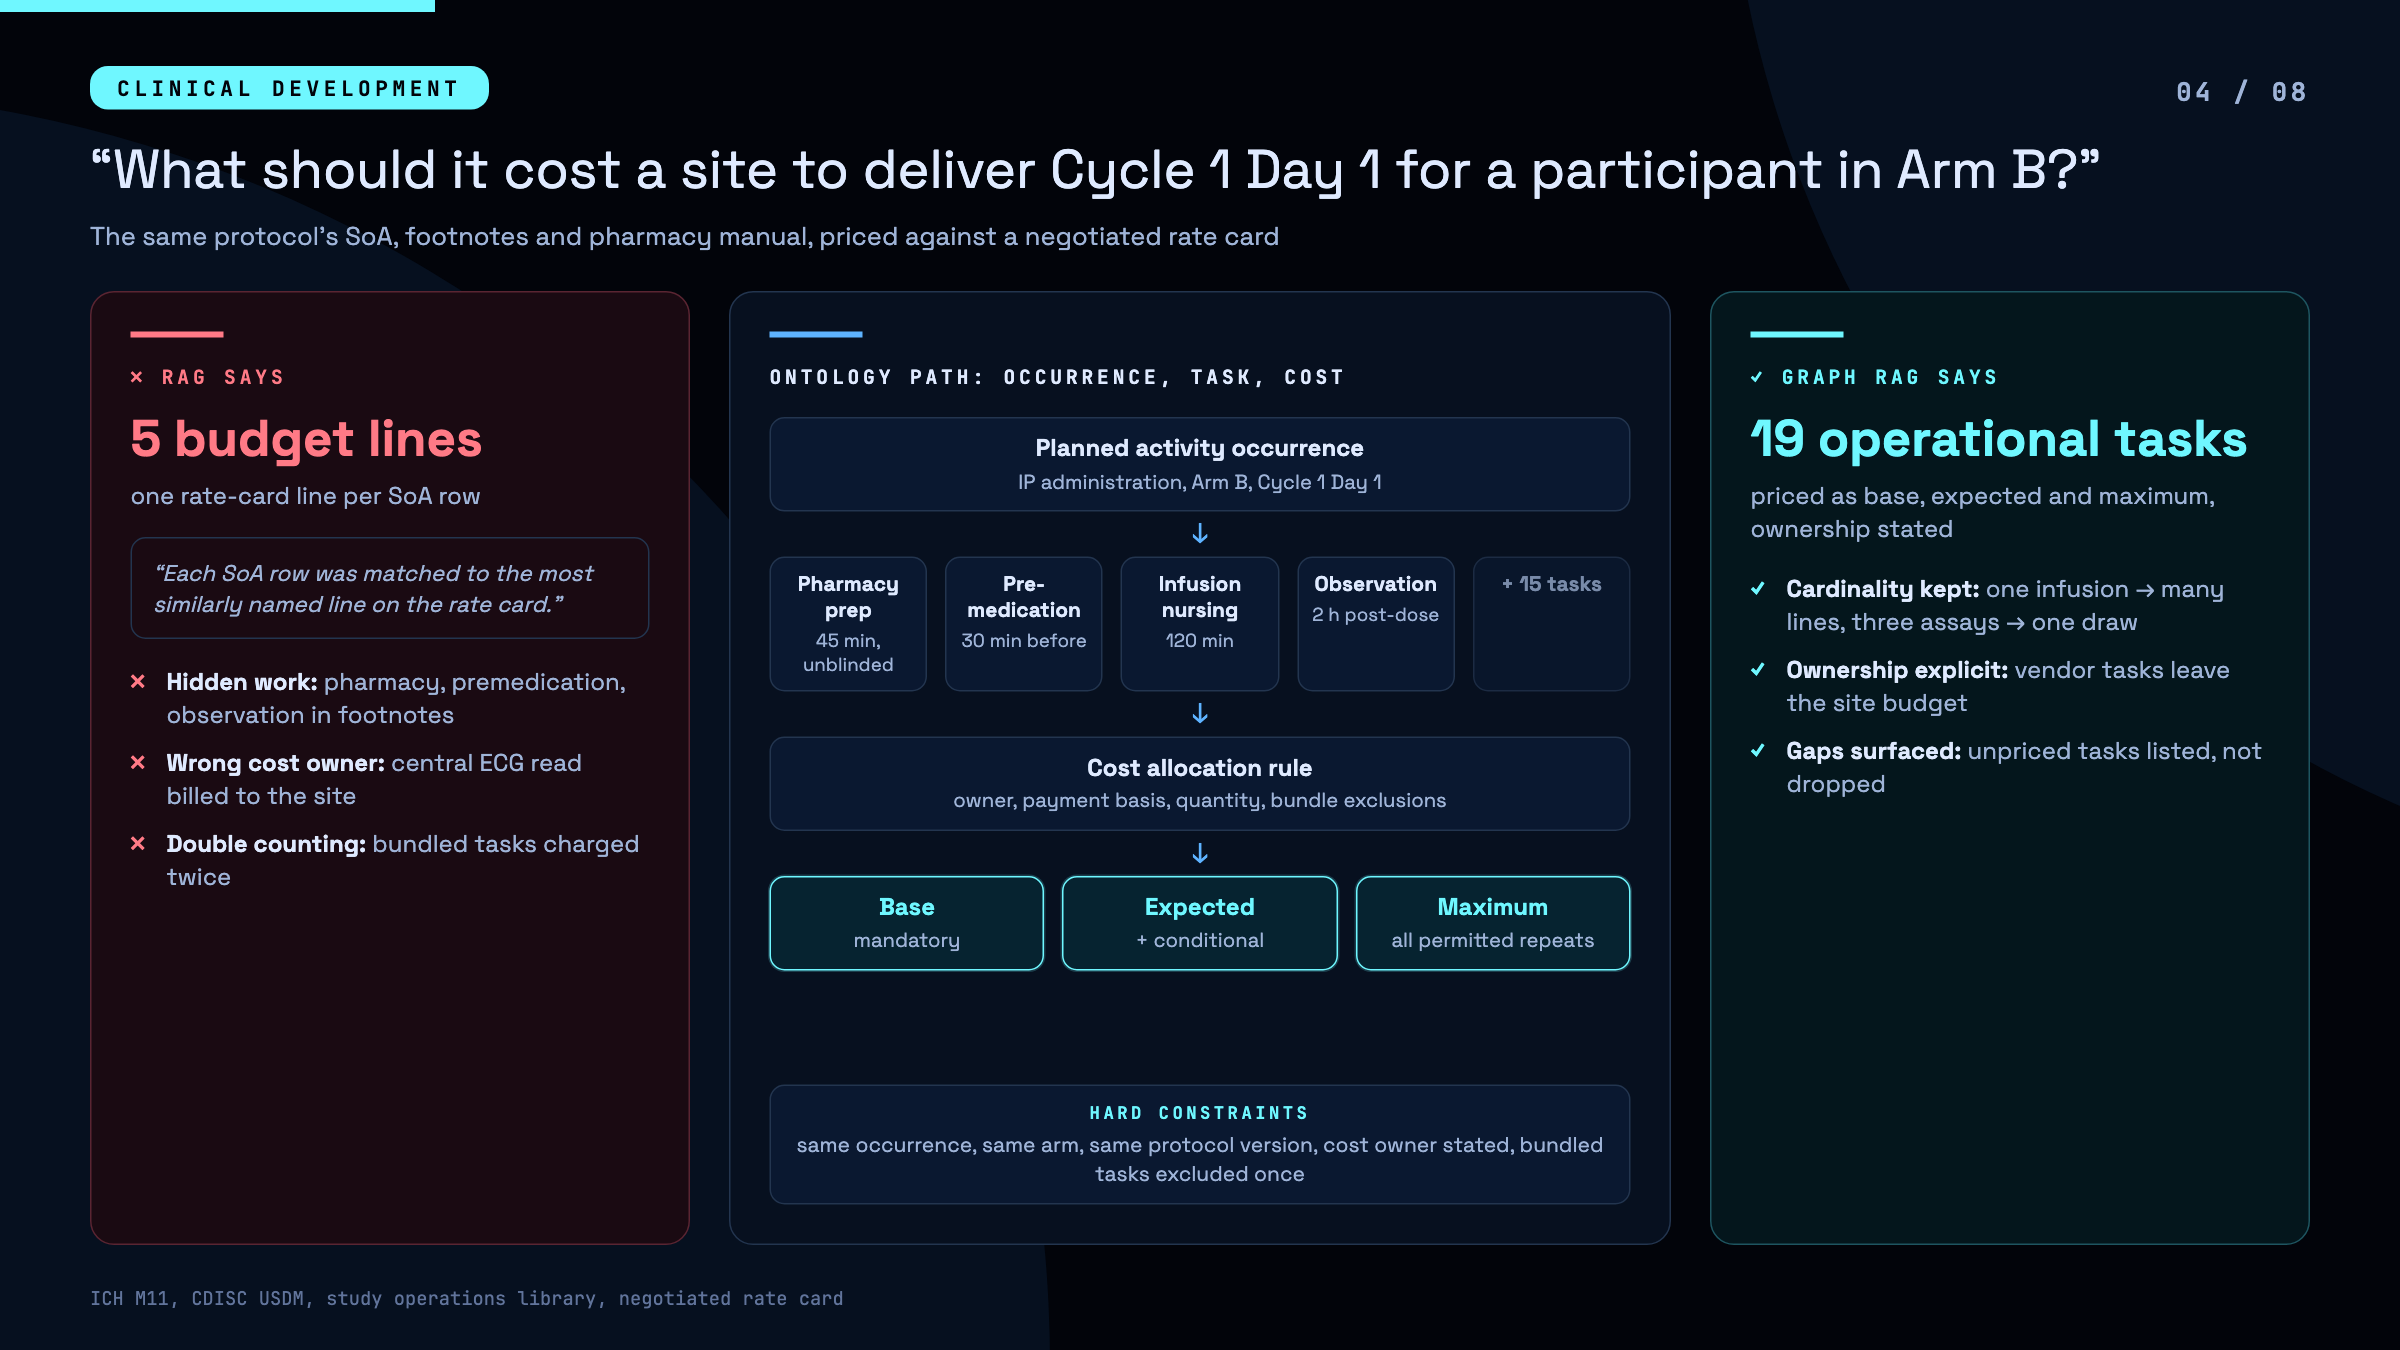
Why RAG fails: it pairs each schedule row with the rate-card line whose name looks closest. Work buried in footnotes disappears, the central ECG read lands on the wrong budget, and bundled tasks get paid twice (reasons 1 and 2).
Why Graph RAG succeeds: one visit activity unfolds into nineteen operational tasks, each carrying a cost owner and bundle rules. You get base, expected and maximum cost, plus a list of tasks nobody has priced yet.
05. Release to Japan on 15 November
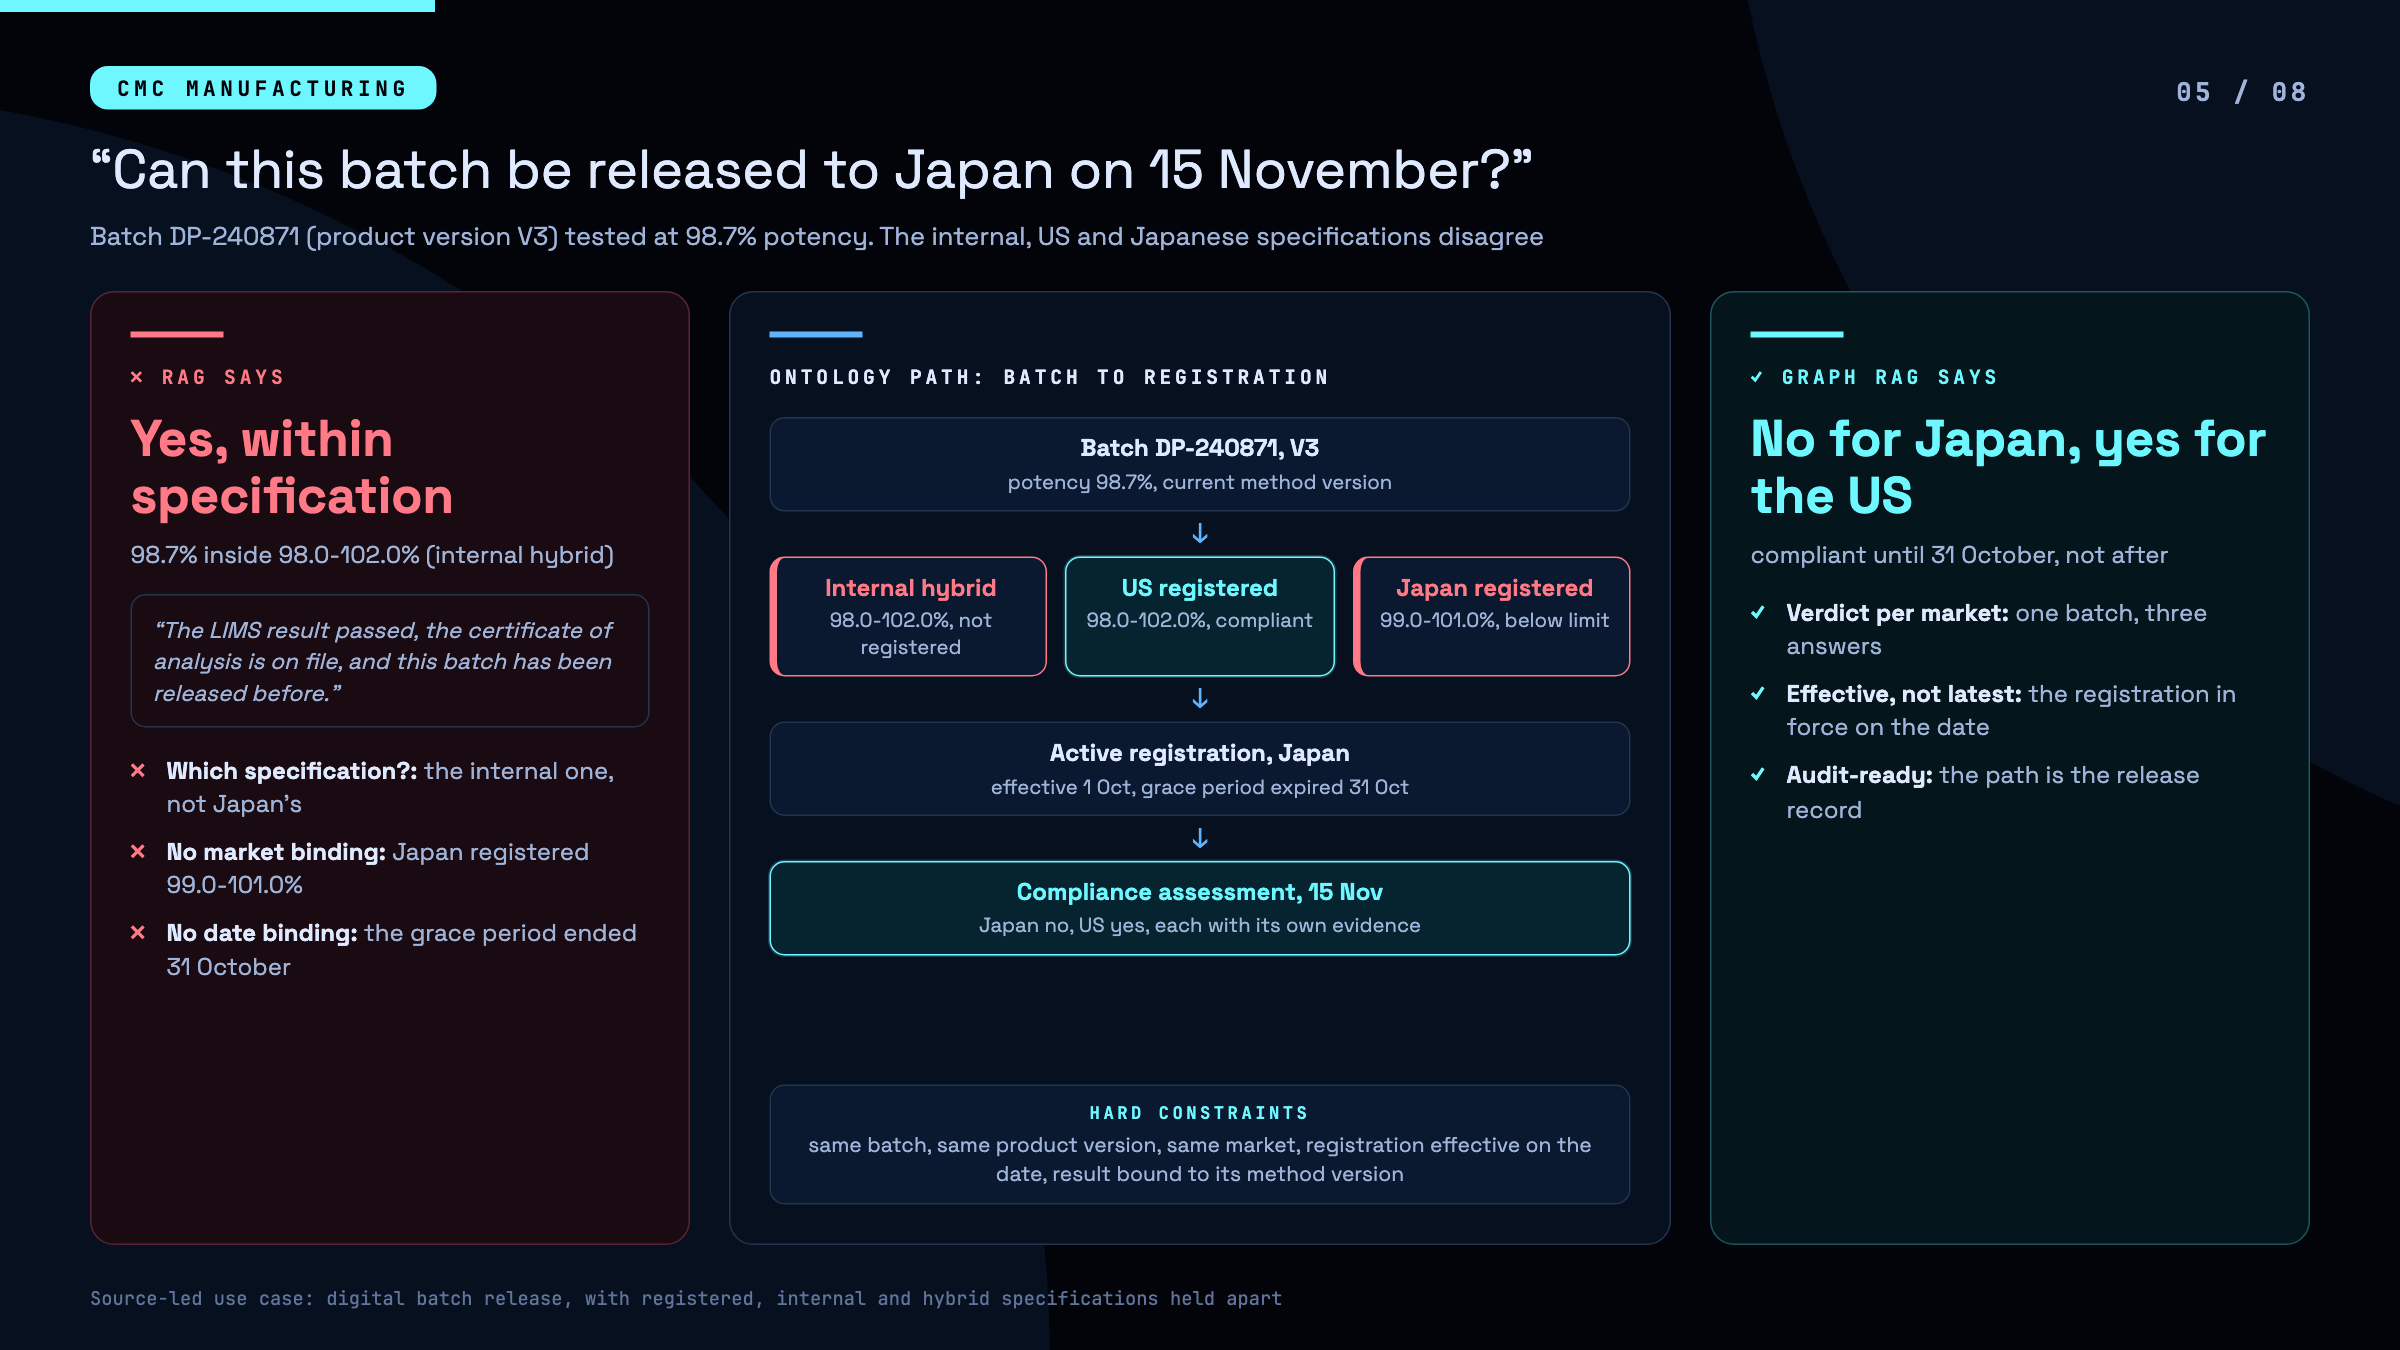
Why RAG fails: “within specification” is true, against the internal specification. RAG never asks which specification applies, in which market, on which date (reason 4).
Why Graph RAG succeeds: internal, US and Japanese limits are separate nodes, and the query reads the registration in force on the requested date. The expired grace period decides it. The route the query took doubles as the release record.
06. Where the process yield was lost
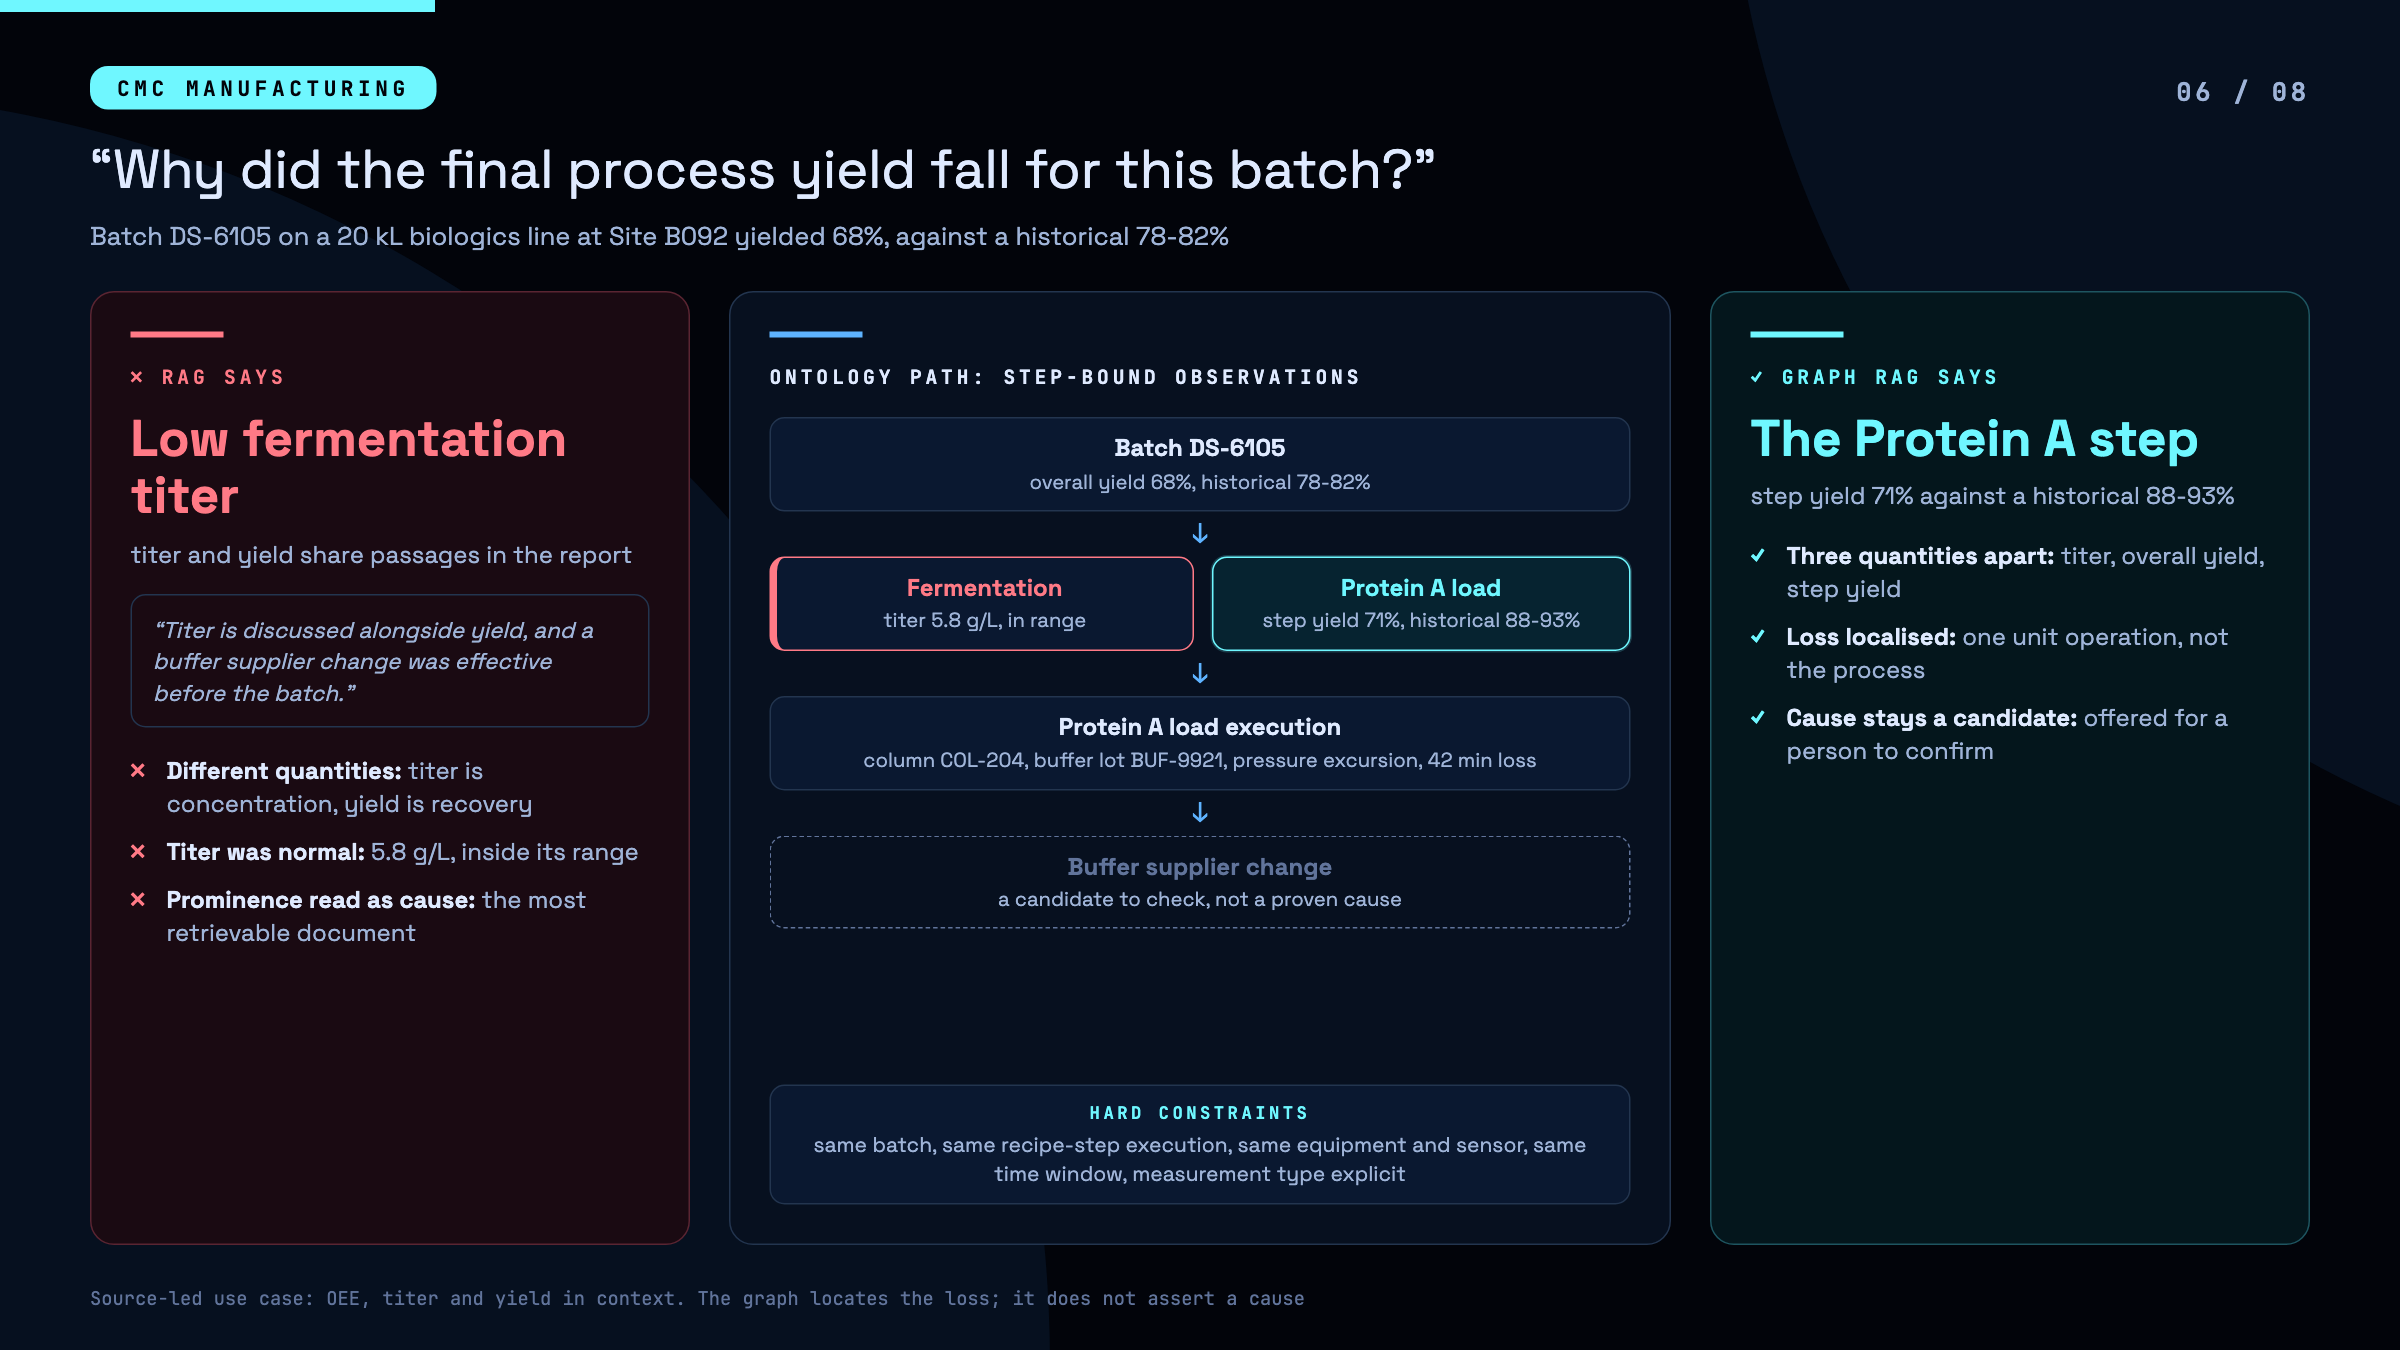
Why RAG fails: titer and yield share paragraphs, and the supplier change is the loudest document in the pile. Sitting close together in the text gets mistaken for cause (reasons 1 and 3).
Why Graph RAG succeeds: every measurement is tied to its process step, its equipment and its time window, which pins the loss to the Protein A step. The supplier change stays a candidate for someone to confirm. The graph doesn’t assert causes, and I think that restraint matters as much as the right answer.
07. What a supplier change affects
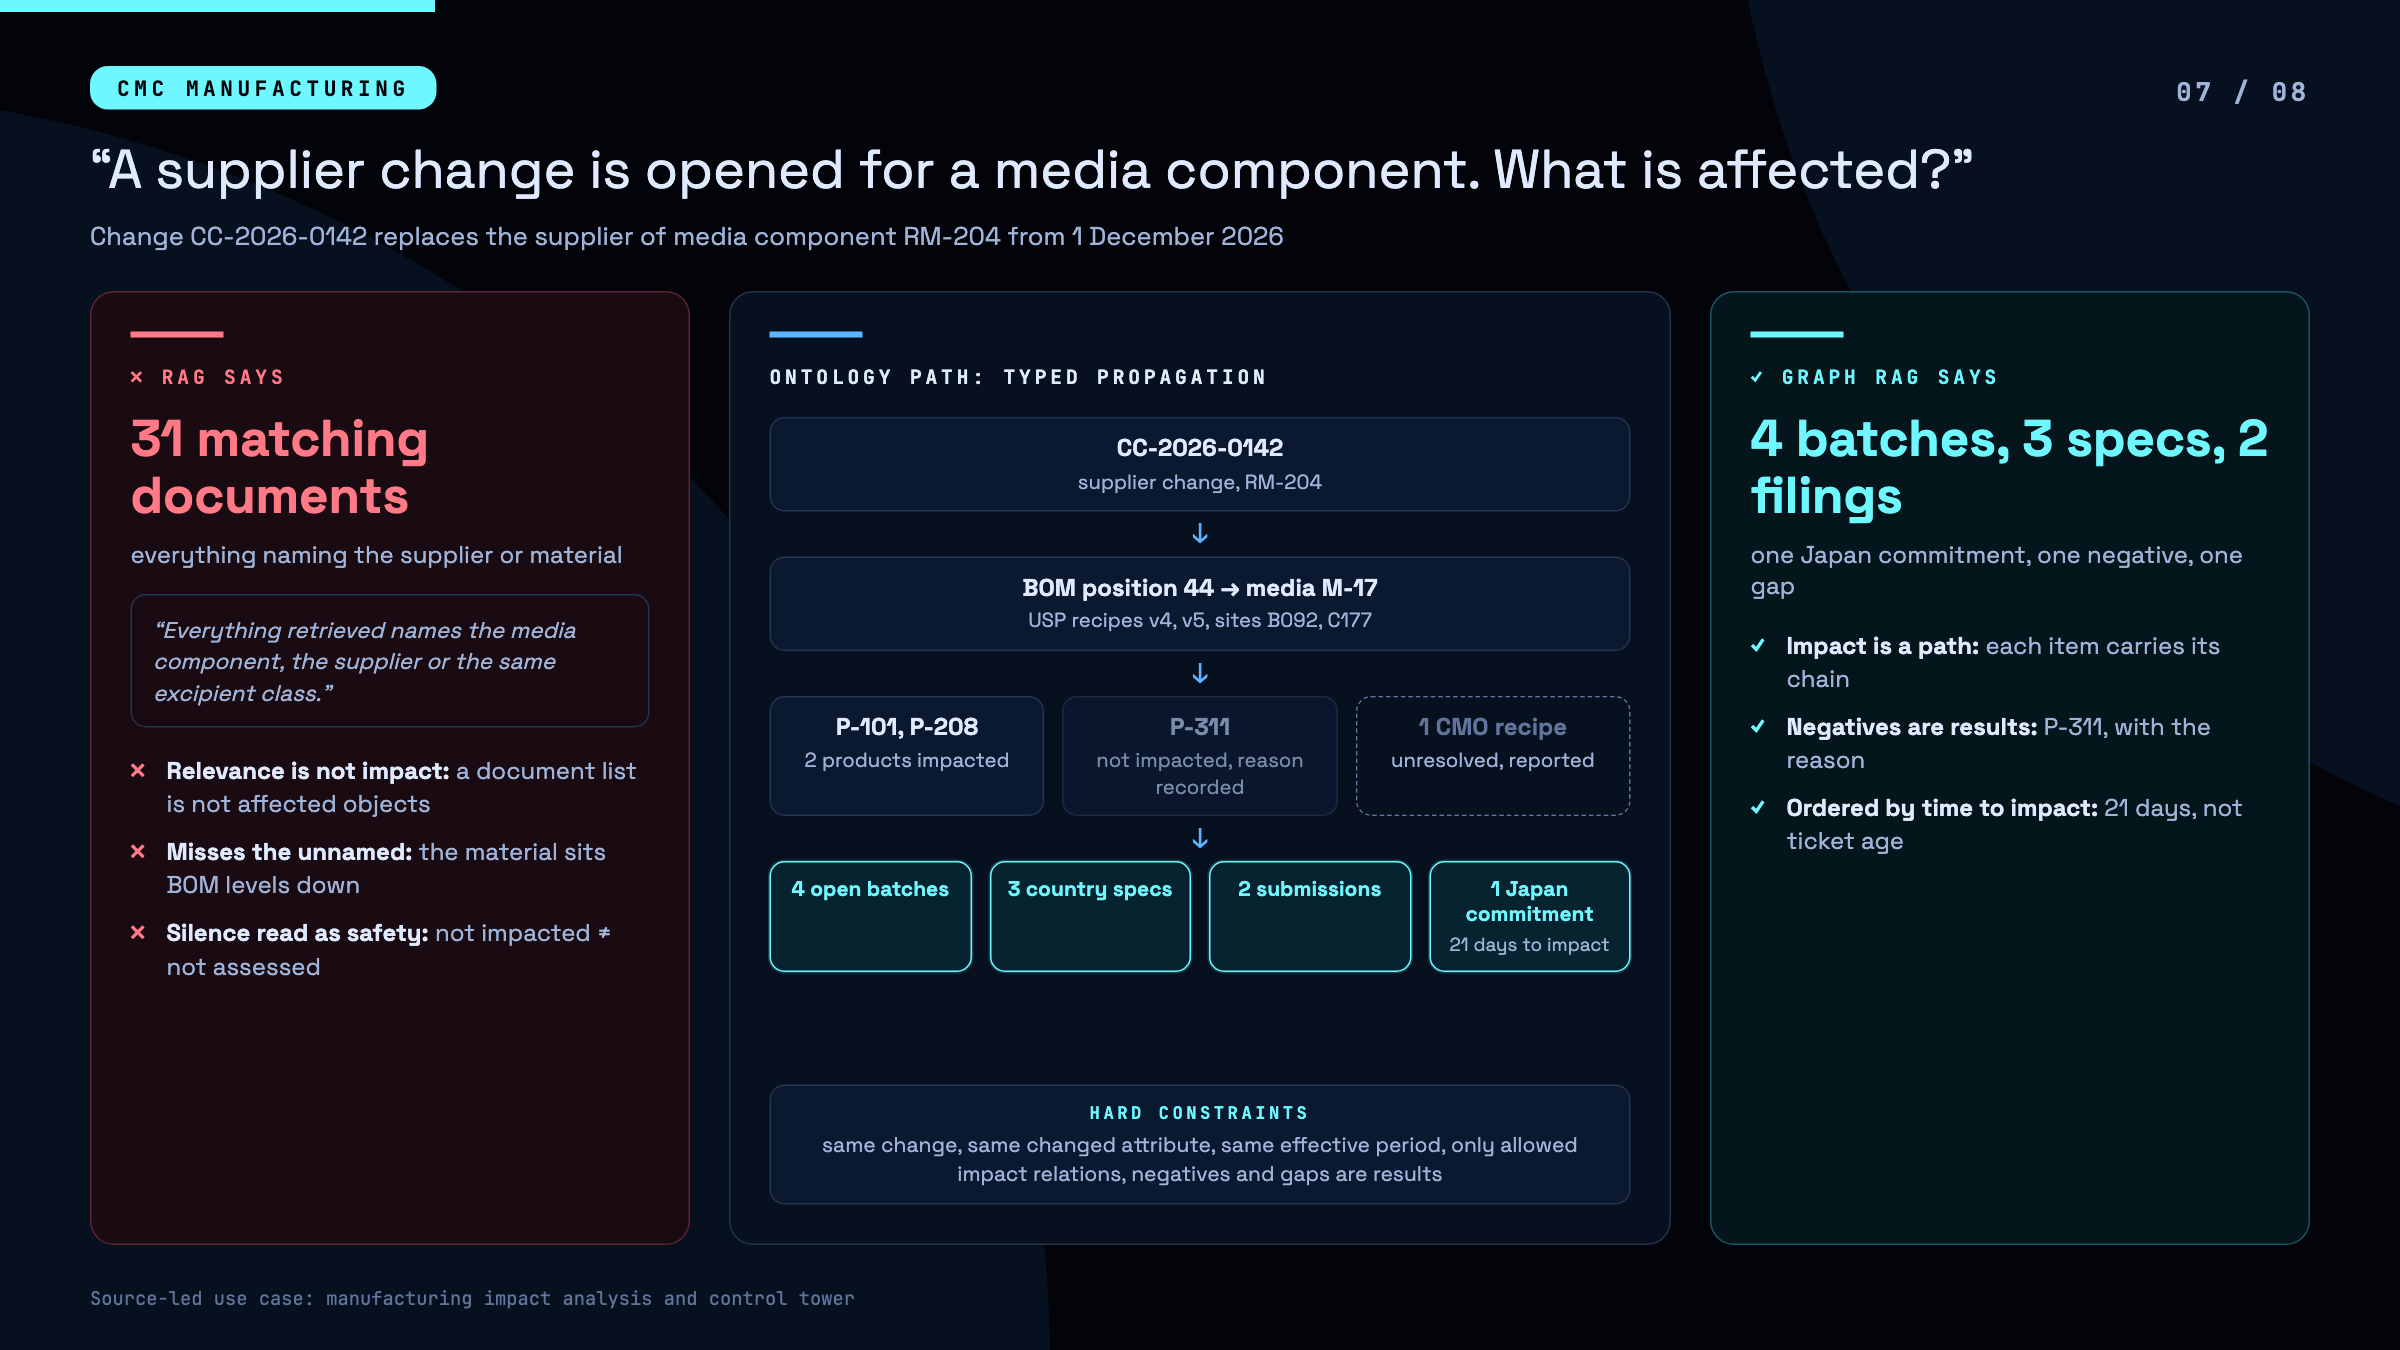
Why RAG fails: it returns 31 documents that mention the material. The products actually affected sit several bill-of-materials levels down, where no document names the material at all (reasons 2 and 4).
Why Graph RAG succeeds: a property path walks change, material, BOM position, product, batch and filing, to whatever depth it takes. “Not impacted” and “unresolved” come back as results, so an empty answer can no longer pass for a safe one.
08. Finished batches containing lot RM-7731
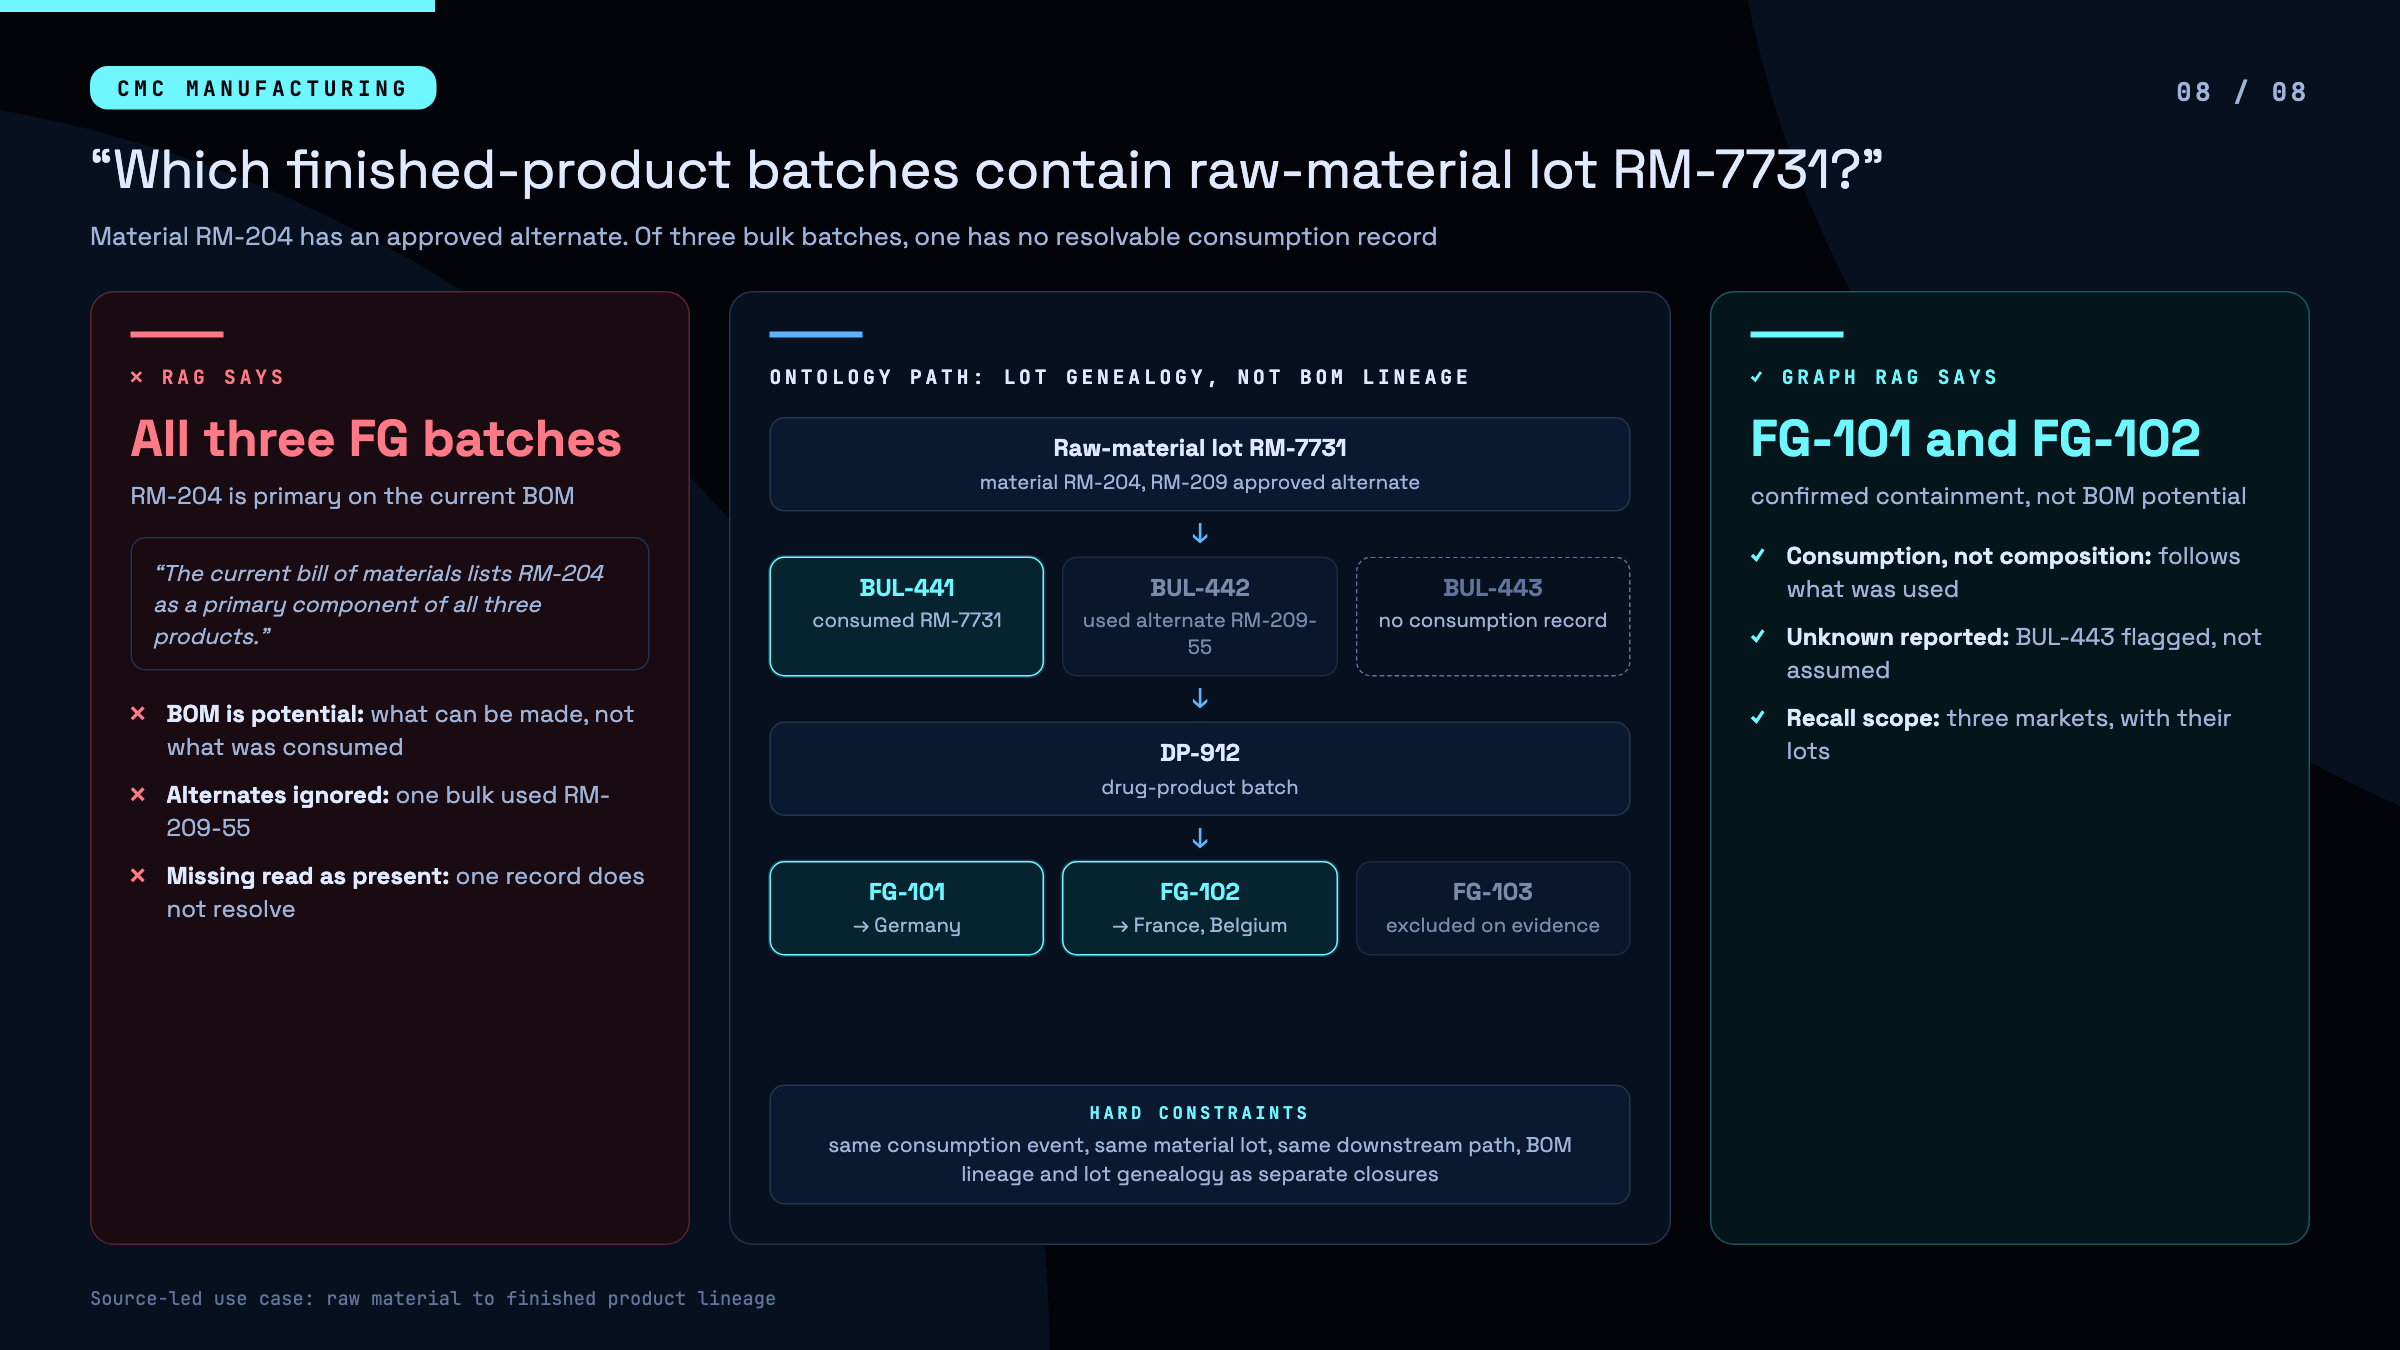
Why RAG fails: a bill of materials tells you what could contain the lot. It says nothing about what did, so the alternate lot and the missing record both stay invisible (reasons 2 and 4).
Why Graph RAG succeeds: it follows recorded consumption events instead of the recipe. FG-103 drops out on evidence, and the bulk lot with no record is reported as unknown. Potential and confirmed containment are kept as two separate traces, so they never blur.
The pattern in one table
| What goes wrong | Examples | Cause in RAG | What prevents it in Graph RAG |
|---|---|---|---|
| Two relationships merged | 01, 06 | embeddings ignore relation type | typed predicates with their own identifiers |
| Role on the wrong thing | 02 | prominence ranking | role modelled on the operation |
| Wrong thing counted | 03, 04, 07 | LLM counts text rows or documents | COUNT DISTINCT over typed entities |
| No market, date or version | 02, 05 | text carries no validity scope | validity periods filtered in the query |
| Possible read as actual | 06, 08 | co-occurrence read as fact | events kept apart from recipes and causes |
| Silence read as “no” | 07, 08 | missing chunks are invisible | negatives and unknowns stored as results |
What it is worth, and how we would know
A right answer on a slide proves nothing about value, so the value model behind each example keeps three layers apart.
Platform health (uptime, passing shapes) comes first, and it is a licence to operate. I don’t count it as a benefit.
Leverage comes next: reuse counted from the graph itself, multiplied by adoption counted honestly. Each asset in these examples serves four to six consumers beyond the one it was built for. NPS never appears on its own; it travels with reach, cost per adopted user, and the users who never got any value out of it.
Outcome is claimed only as a contribution. That means questions newly answerable (11 of 14 for dose form, 27 of 31 for blood draws) and time to answer, which drops from hours, days or weeks to a single query. Each example also counts the specific error it exists to prevent, such as a market missed in a change assessment or a shipment after a grace period expired.
What we don’t claim is any share of the business outcome. No slice of an approval, a saving or an avoided recall gets credited to the semantic layer. And every figure is quoted net of governance cost: 21 days from candidate term to published, 0.4 hours of effort per governed term, 6% of assets reworked after publication.
A ratio with no denominator is advocacy.
Where Graph RAG does not help
Graph RAG doesn’t replace document search. “What does section 3.2.P.5 say?” is a text question, and plain RAG handles it well.
The harder limit is that a graph only knows what someone modelled. If nobody modelled the relationship between a recipe version and a CMO, the graph can’t follow it, and in example 07 that is exactly the gap it reports as unresolved. Building and governing that model costs real time, and the friction budget above is there because I have seen that cost underestimated more than once. My honest read: the case for a graph is narrow and strong. It pays off on questions whose answer depends on how facts connect (counts, roles, validity, propagation, genealogy), which happen to be the questions a regulated business can least afford to get plausibly wrong.
So which of your questions are like these?
Every one of these eight is asked weekly somewhere in a regulatory, clinical or manufacturing team. Today an expert answers it, someone who knows which facts belong together. Hand that expert a RAG assistant and they get a fluent draft they still have to check line by line.
Try this: take the five questions your teams ask most often and check each against the table above. If an answer depends on a count, a role, a date or a chain, retrieval will hand you something plausible. Whether it is right is another matter.